

Geospatial Mapping
The BI Office mapping component has been designed to portray query results on a map in the most intuitive fashion without requiring extensive skill or expertise by the end user.
Mapping Mechanism Overview
BI Office 6 offers two "lookup" techniques for portraying map data.
- Technique One (PAID Lookup): the lookup is done via an index key to match between the selected elements and the shapes built directly into the data model (cube). For example, the Australia.key would be matched against the Pyramid GIS shape for the same key. This technique is deployed by advanced model designers outside of BI Office.
- Technique Two (Text Lookup): the lookup is done via text labels (for example “Australia”) that the BI Office engine uses to find the exact matching shape or data point and plot it on appropriately the map.
The approach requires users to set their model hierarchies to a particular mapping data type to produce the lookup. This technique can be done by both administrators and end users inside BI Office directly.
Regardless of technique, if geospatial data cannot be attached via this method, the mapping engine will attempt to GEOCODE the data points (usually an address) and plot the data onto the map. The map component is currently able to render :
- shape polygons representing geographic regions (like continents, countries, counties and zip/postal codes)
- single point locations when the data is not appropriately presented or the geographic entity is not available as shapes (like cities and addresses).
The data can be plotted on a wire frame map in "mercator" mode, or against map image tiles in the road or aerial view map styles. Generally, global data can be viewed in all map styles, while smaller regional or address data is best viewed using the tiled maps.
All map types offer full interactivity and "data navigation" through a right-click context menu, including drill downs/ups, expand/collapse, dicing, focus/eliminate and cube actions. And all data points on a map can be customized and themed via the Map Ribbon Tab.
Map Visuals: Shapes vs. Pies (push-pins)
Geospatial data can be represented in 2 main forms:
- as regions on a map drawn as shapes
- or as points on a map drawn as push-pins (or pies).
The mapping component will attempt to draw regional data that is included in the Pyramid GIS database as shapes if there is a single point of data. If there is NO shape, or if there are multiple points of data, the component will draw the data as a pie chart centered at the point of interest on the map.
Typically, Continents, Countries, States, Counties and Postal (Zip) Codes are all designated as regions, and can be drawn as shapes on a map. Cities usually cannot be drawn as regions, since there are few, if any, standardized definitions for a city's regional boundaries. Single addresses are also drawn as single point push pins.
The standard Pyramid GIS database currently has geospatial data for the following entities. All other entities are geocoded at run time:
- World Continents
- World Countries
- World States & Provinces
- World Cities
- US Counties
- US Zip Codes
NOTE: There are updated city shapes for the US available
Regional Shapes as Pies
Shape images can only show 2 data points: the region of interest and a singular metric. When regional data has data multiple points, the Pyramid engine will also swap the shape image for a multi-segment pie chart, in an attempt to better portray the multi-dimensional aspects of the query on a map.
Geocoding
The Pyramid engine geocodes addresses when it cannot find predefined geospatial data related to the entity. Geocoding is a process that involves taking the entities geographic information (like an address) and sending it to a special web service. This service then returns the latitude and longitude points for this entity so it can be plotted on a map.
Multi-lingual Maps and Cultures
Map details can be shown in a variety of languages. Further, any addresses or location names provided in a non-English language can also be geocoded in a variety of languages.
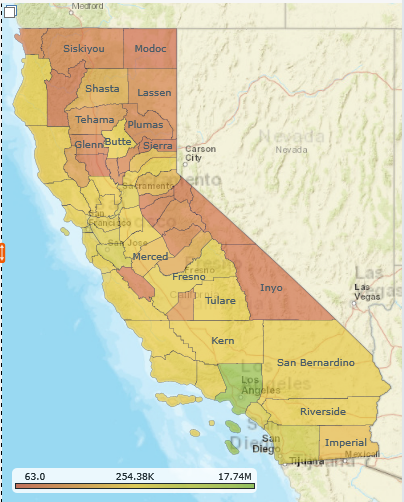
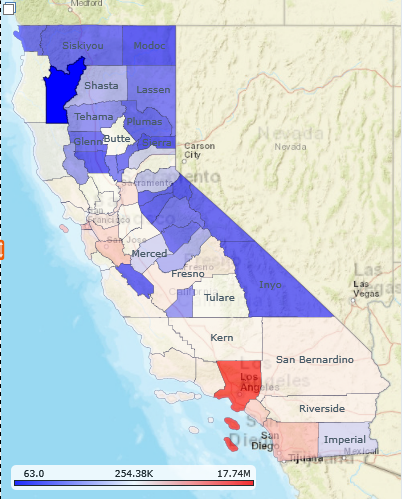
Shape Heat Maps
The heat map engine is designed for the shape polygons only. It can be applied using 3 colors ("tri-color") or 2 colors ("dual color"). The colors are automatically sourced from the prevailing map theme; from a small set of preset colors or from manual choices made by the end user using the more options dialog.
The dialog exposes color choices as well as the mechanism for the tri-color distribution: Average or Median.
- The Average uses the mean amongst all items in the data set to determine the mid-point
- The Median (50th percentile) uses the median value amongst all items in the data set to determine the mid-point
| Theme tri-color | Preset tri-color |
|---|---|
|
|
Map Legends
The mapping component displays 3 legends and one warning image:
- All map types show a map scale bar in the bottom right hand corner
- Shape maps show a color range legend in the bottom left hand corner. The legend shows the range of colors used in the imaging as per the conditional formatting options (as described above)
- Push-Pin / Pie maps show a legend of items that appear as segments in the pie charts in the left hand corner. The items and the colors are auto-determined by the query and the themes used for formatting the maps and report.
- A Warning legend icon is shown in the top right hand corner when data is geocoded. This legend is displayed if there are any issues geocoding data, or the geocoding limit has been reached.
Map Examples
The following samples will be used to highlight some of the features of the geospatial mapping component.
| Examples | Samples |
|---|---|
| Polygon Shapes on a Mercator Map |
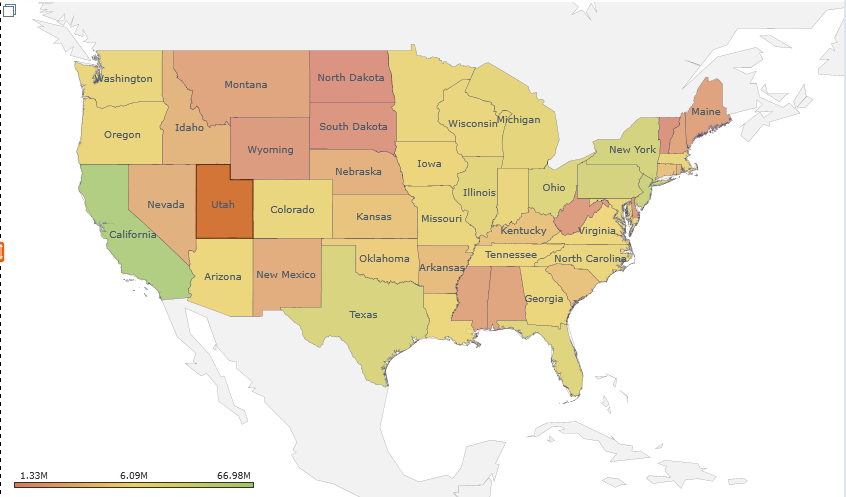
|
| Polygon Shapes on a Road View Map |
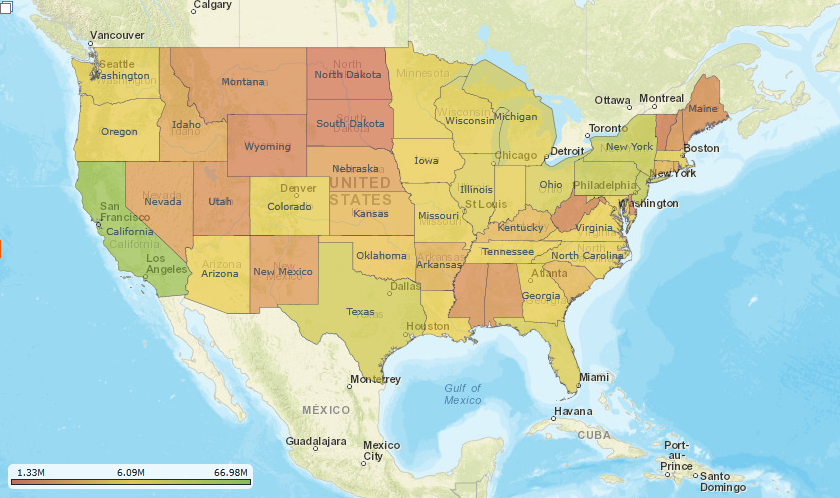
|
|
Multi-dimensional data plotted as push-pin pie charts on an Aerial/Satellite View Map |
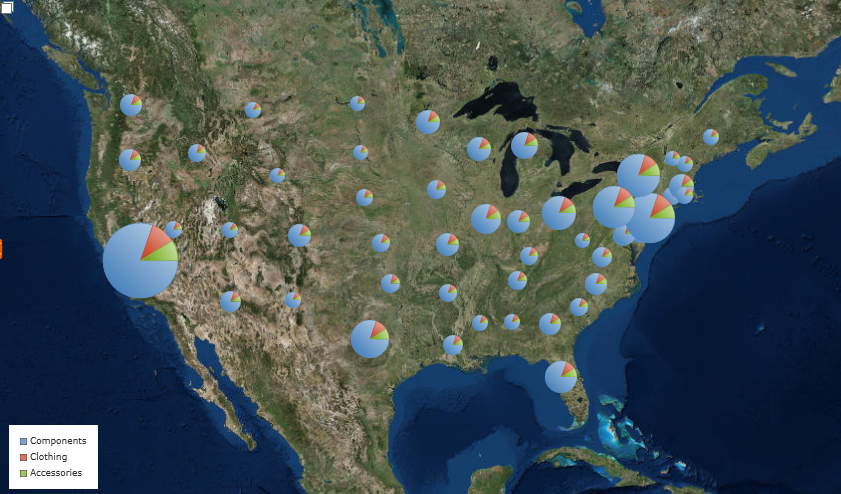
|
| Multi-dimensional data plotted as push-pin pie charts on an Aerial/Satellite with Labels View Map |
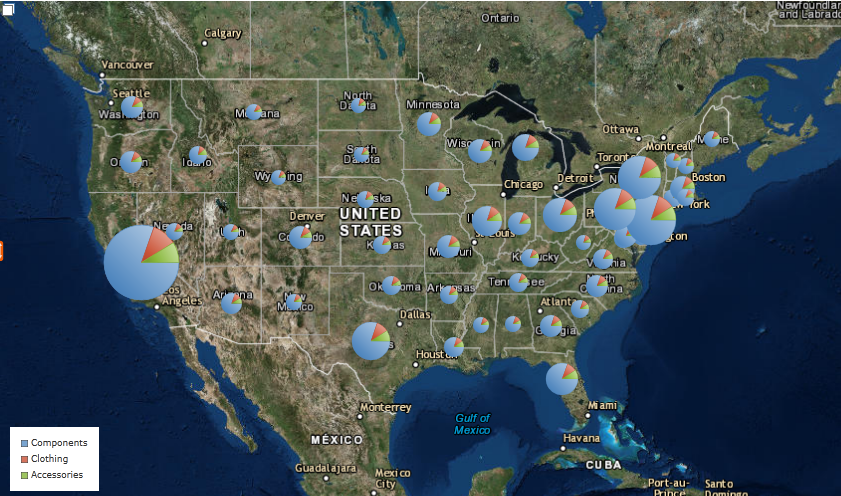
|
| Plotted cities on a Mercator Map |
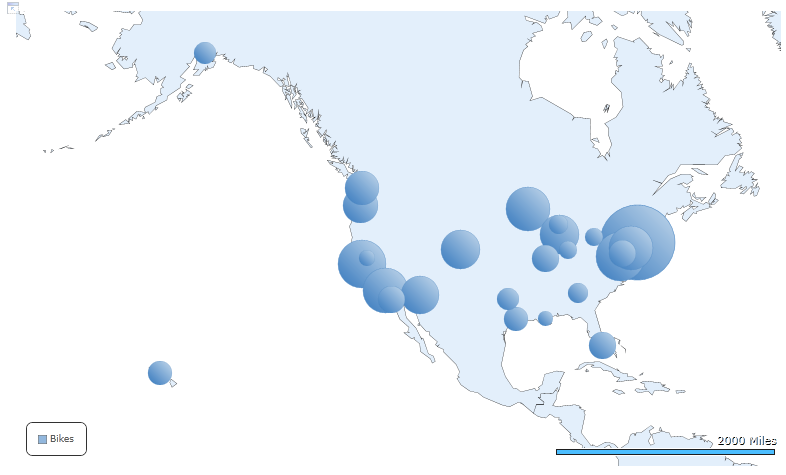
|
| Plotted addresses geocoded on a Road View Map |
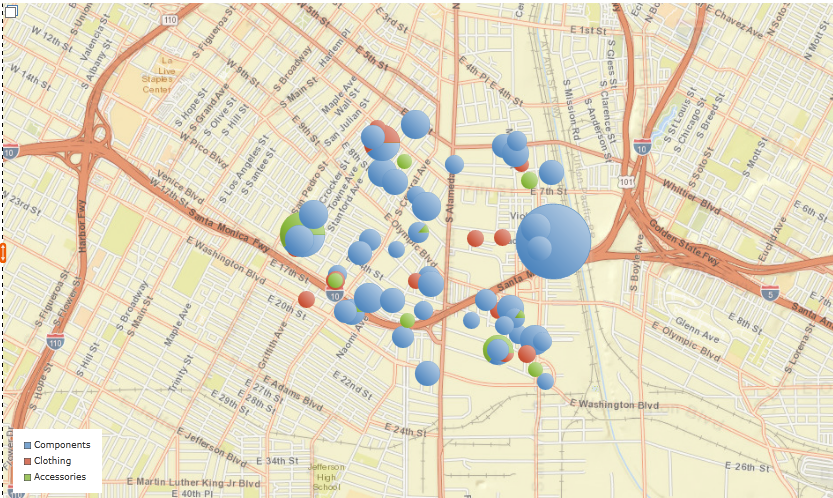
|
Home |
Table of Contents |
Index |
User Community
Pyramid Analytics © 2011-2022